Yes, with our Auto export feature you are able to auto export the User charts you already created in an earlier phase.
- The first step is to save your charts as User charts.
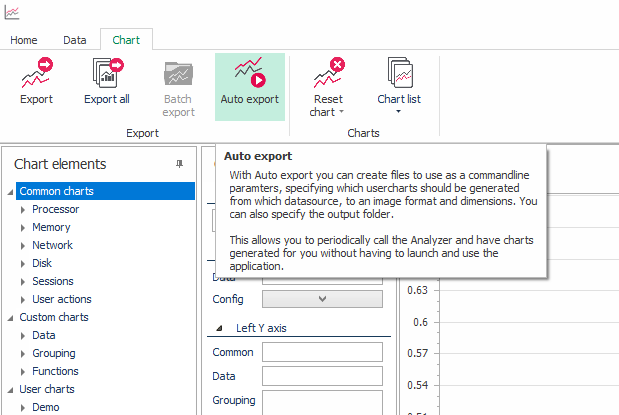
- Then you can chose Chart and Auto export from the ribbon bar in the LoadGen Analyzer
- Choose Create or Edit an analysis set.
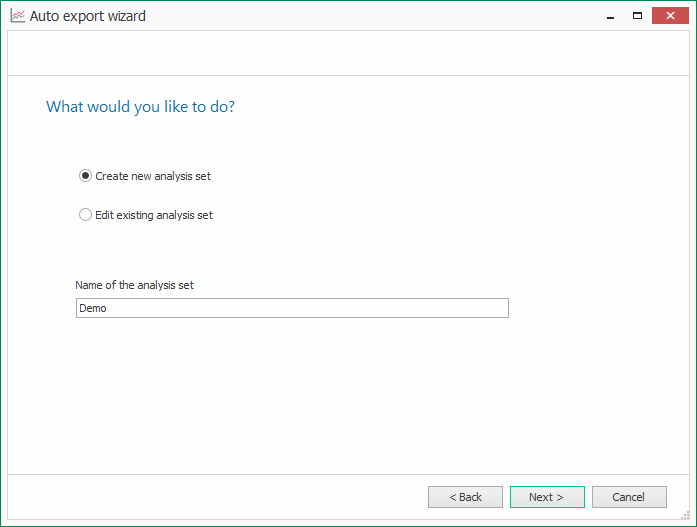
- In this example, we chose Create new analysis set, named the analysis set, and pressed Next.
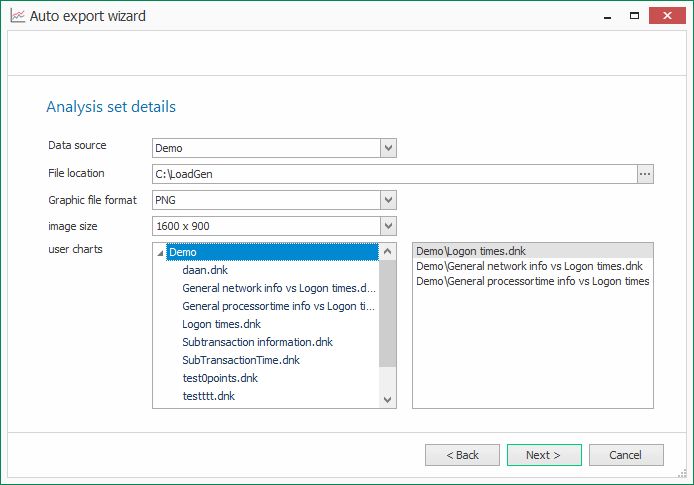
- Select the data source, file location (where the charts are exported to), the graphic file format (PNG, JPG, BMP, TIFF, GIF), the image size, and drag and drop the charts you want to auto-export in the right pane. Press Next when finished.
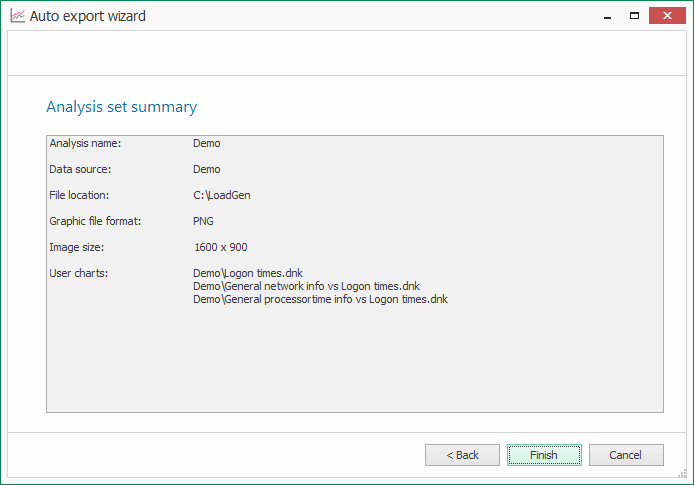
- Check the summary and press Finish.
- You can now run the LoadGen Analyzer with the following command line: "C:\Program Files\LoadGen\LoadGen Analyzer\LoadGen Analyzer.exe" demo.xml (where demo is the name of the analysis set.
Change your data source dynamically
- You can dynamically load the data source by changing your analysis set XML file. Go to the location: C:\ProgramData\LoadGen\Analyzer\Analysis
- Change the <SETTINGS><DATASOURCE> node to the correct data source.
- See the example below of the demo.xml analysis set.
<?xml version="1.0" standalone="yes"?>
<ANALYSISSET>
  <xs:schema id="ANALYSISSET" xmlns="" xmlns:xs="http://www.w3.org/2001/XMLSchema" xmlns:msdata="urn:schemas-microsoft-com:xml-msdata">
    <xs:element name="ANALYSISSET" msdata:IsDataSet="true" msdata:UseCurrentLocale="true">
      <xs:complexType>
        <xs:choice minOccurs="0" maxOccurs="unbounded">
          <xs:element name="SETTINGS">
            <xs:complexType>
              <xs:sequence>
                <xs:element name="DATASOURCE" type="xs:string" minOccurs="0" />
                <xs:element name="FILEPATH" type="xs:string" minOccurs="0" />
                <xs:element name="FILEFORMAT" type="xs:string" minOccurs="0" />
                <xs:element name="IMAGESIZE" type="xs:string" minOccurs="0" />
              </xs:sequence>
            </xs:complexType>
          </xs:element>
          <xs:element name="USERCHARTS">
            <xs:complexType>
              <xs:sequence>
                <xs:element name="CHARTNAME" type="xs:string" minOccurs="0" />
              </xs:sequence>
            </xs:complexType>
          </xs:element>
        </xs:choice>
      </xs:complexType>
    </xs:element>
  </xs:schema>
  <SETTINGS>
    <DATASOURCE>Demo</DATASOURCE>
    <FILEPATH>C:\LoadGen</FILEPATH>
    <FILEFORMAT>PNG</FILEFORMAT>
    <IMAGESIZE>1600 x 900</IMAGESIZE>
  </SETTINGS>
  <USERCHARTS>
    <CHARTNAME>Demo\Logon times.dnk</CHARTNAME>
  </USERCHARTS>
  <USERCHARTS>
    <CHARTNAME>Demo\General network info vs Logon times.dnk</CHARTNAME>
  </USERCHARTS>
  <USERCHARTS>
    <CHARTNAME>Demo\General processortime info vs Logon times.dnk</CHARTNAME>
  </USERCHARTS>
</ANALYSISSET>
Load & Performance Test full and End-to-End Monitoring versions only
This feature is only supported in the Load & Performance full and End-to-End Monitoring versions.